The cryptocurrency market is entering a very interesting phase. Bitcoin halving, which is expected to take place in mid-2024, is an event that is increasingly capturing the imagination of investors. However, if history rhymes, a mature bull market will not begin until next year at the earliest.
According to the latest data, Bitcoin halving is already 85% complete. At the same time, supply held by long-term holders (LTHs) is close to its all-time high (ATH). In previous cycles, this was a signal of the vicinity of a macro bottom, followed by the early phase of a new cycle.
Supply Held by Long-Term Holders Approaches ATH
The indicator of BTC supply in the hands of long-term holders has historically been a good measure of the health of the cryptocurrency market. Historically, this metric has negatively correlated with the long-term price action of the largest cryptocurrency.
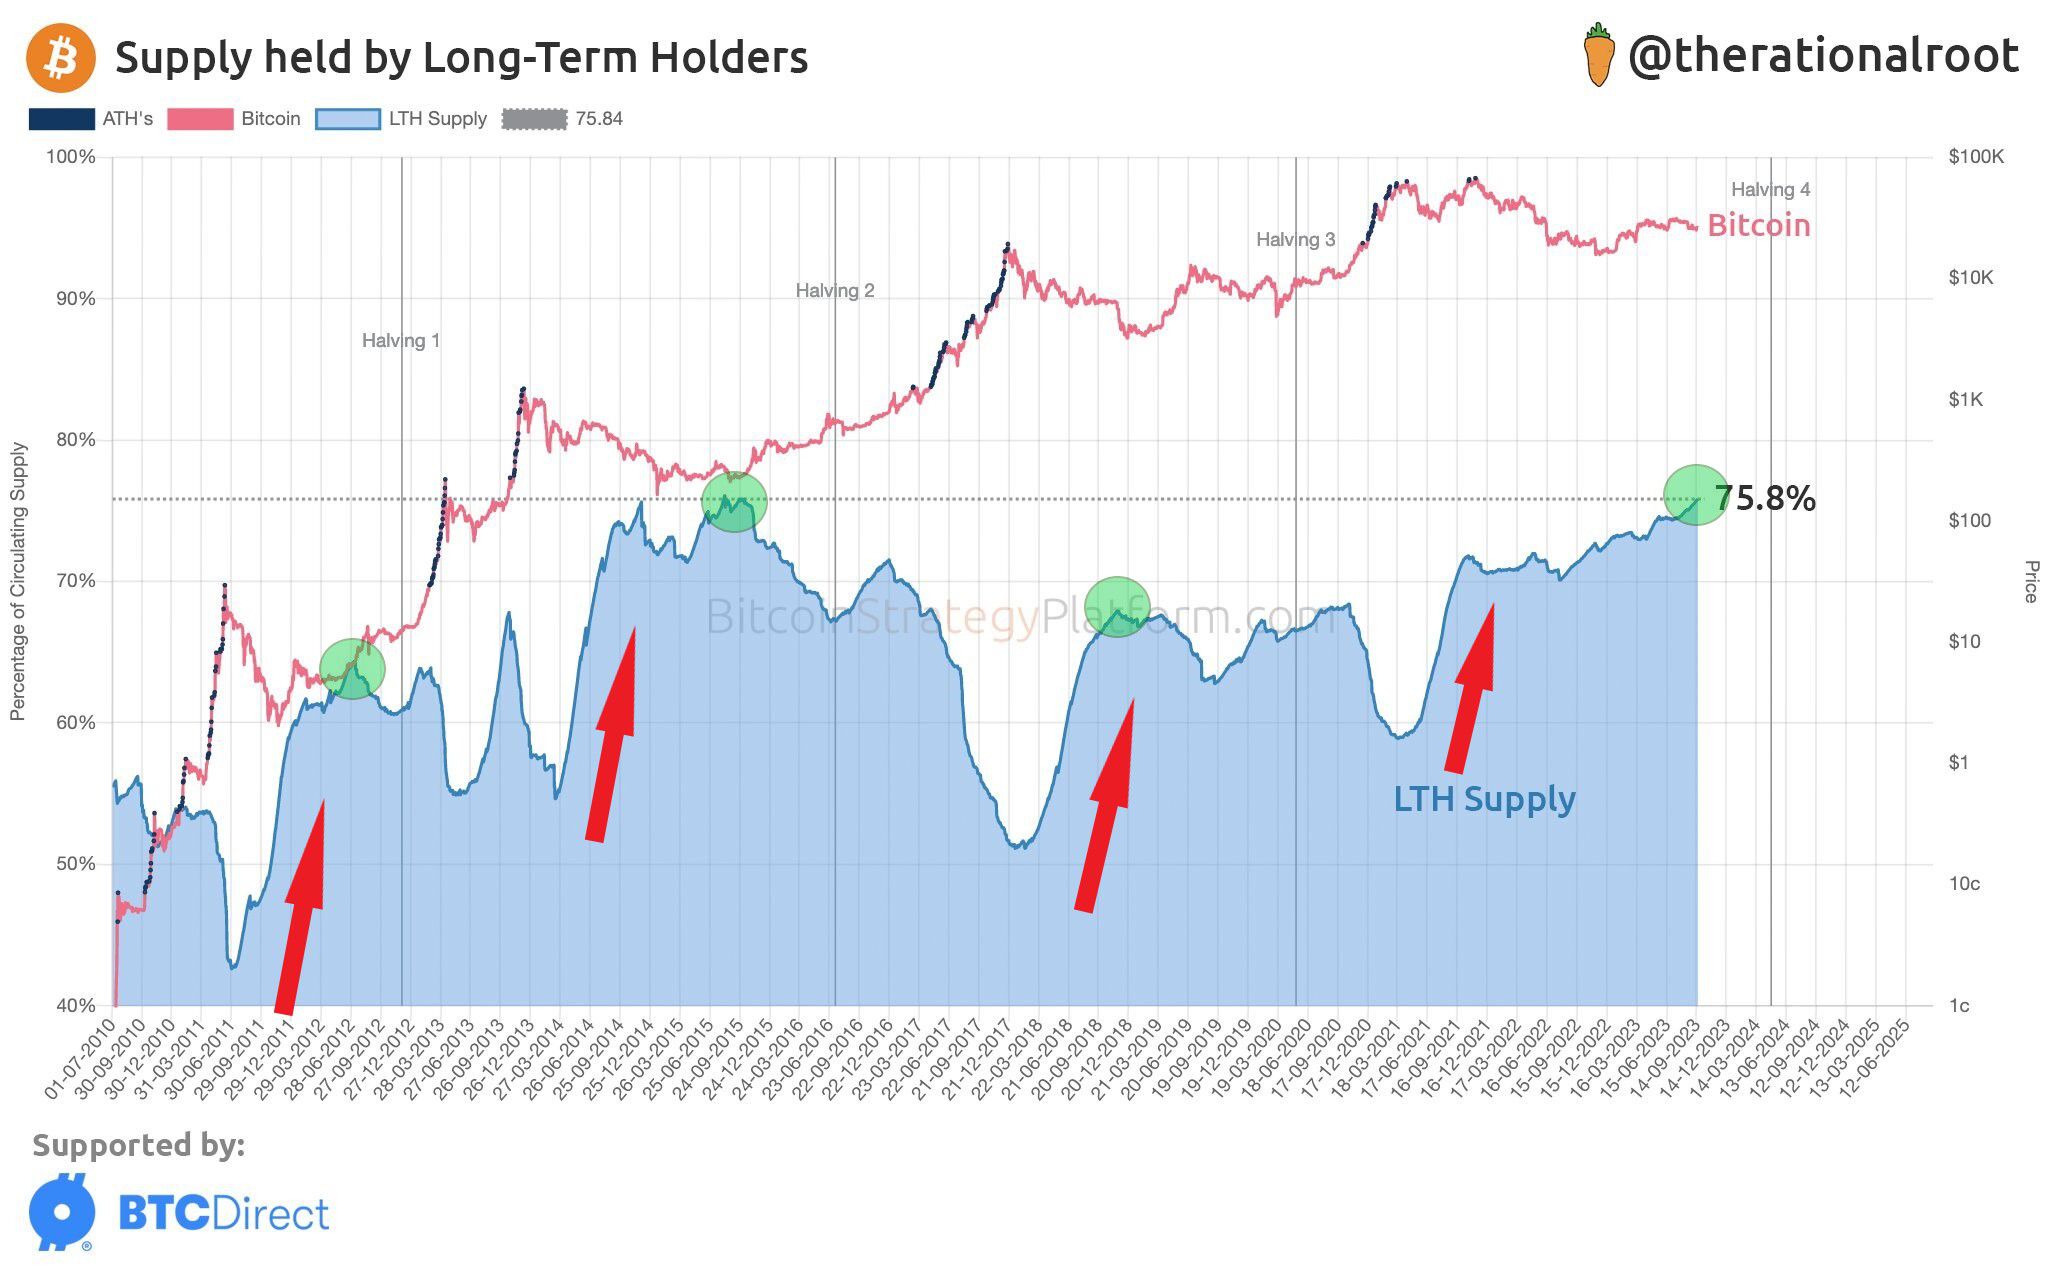
Long-term hodlers keep (HODL) their assets unmoved during market bottoms. Moreover, the largest supply increase in LTH’s hands occurs during violent bear markets (red arrows). This is when investors with strong hands, seeing the price of BTC plummeting, are reluctant to sell. They hold on to their coins because they believe that the cryptocurrency market will bounce back in the future and their investment will prove profitable.
In contrast, the opposite is true during an unraveling bull market. The surge in BTC price causes LTHs to become more and more willing to sell their assets at a profit. Historically, during each major bull market, we have witnessed a dramatic drop in supply held by LTHs. Naturally, the coins then move into the hands of short-term holders (STHs), who join the market at a late stage, driven by the desire to make a quick profit.
Cryptocurrency analyst @therationalroot published a chart of Bitcoin supply in the hands of long-term holders on X. He also superimposed each halving Bitcoin on his drawing. In his chart, we notice first of all the fact that currently, the BTC supply ratio in the hands of LTHs is close to its ATH near 76%. This was set at the end of 2015 when the BTC price ended the accumulation phase before the second halving.

We then see that each time, the indicator reached the peak of a given cycle several months before Bitcoin halving (green circles) occurred. Then, after this local peak, the supply in the hands of LTHs gradually declined and headed sideways until several months after the next halving. It wasn’t until about 6 months after this event that there was a strong decline in this metric, and cryptocurrencies entered a mature bull market.
Bitcoin Halving is 85% Complete
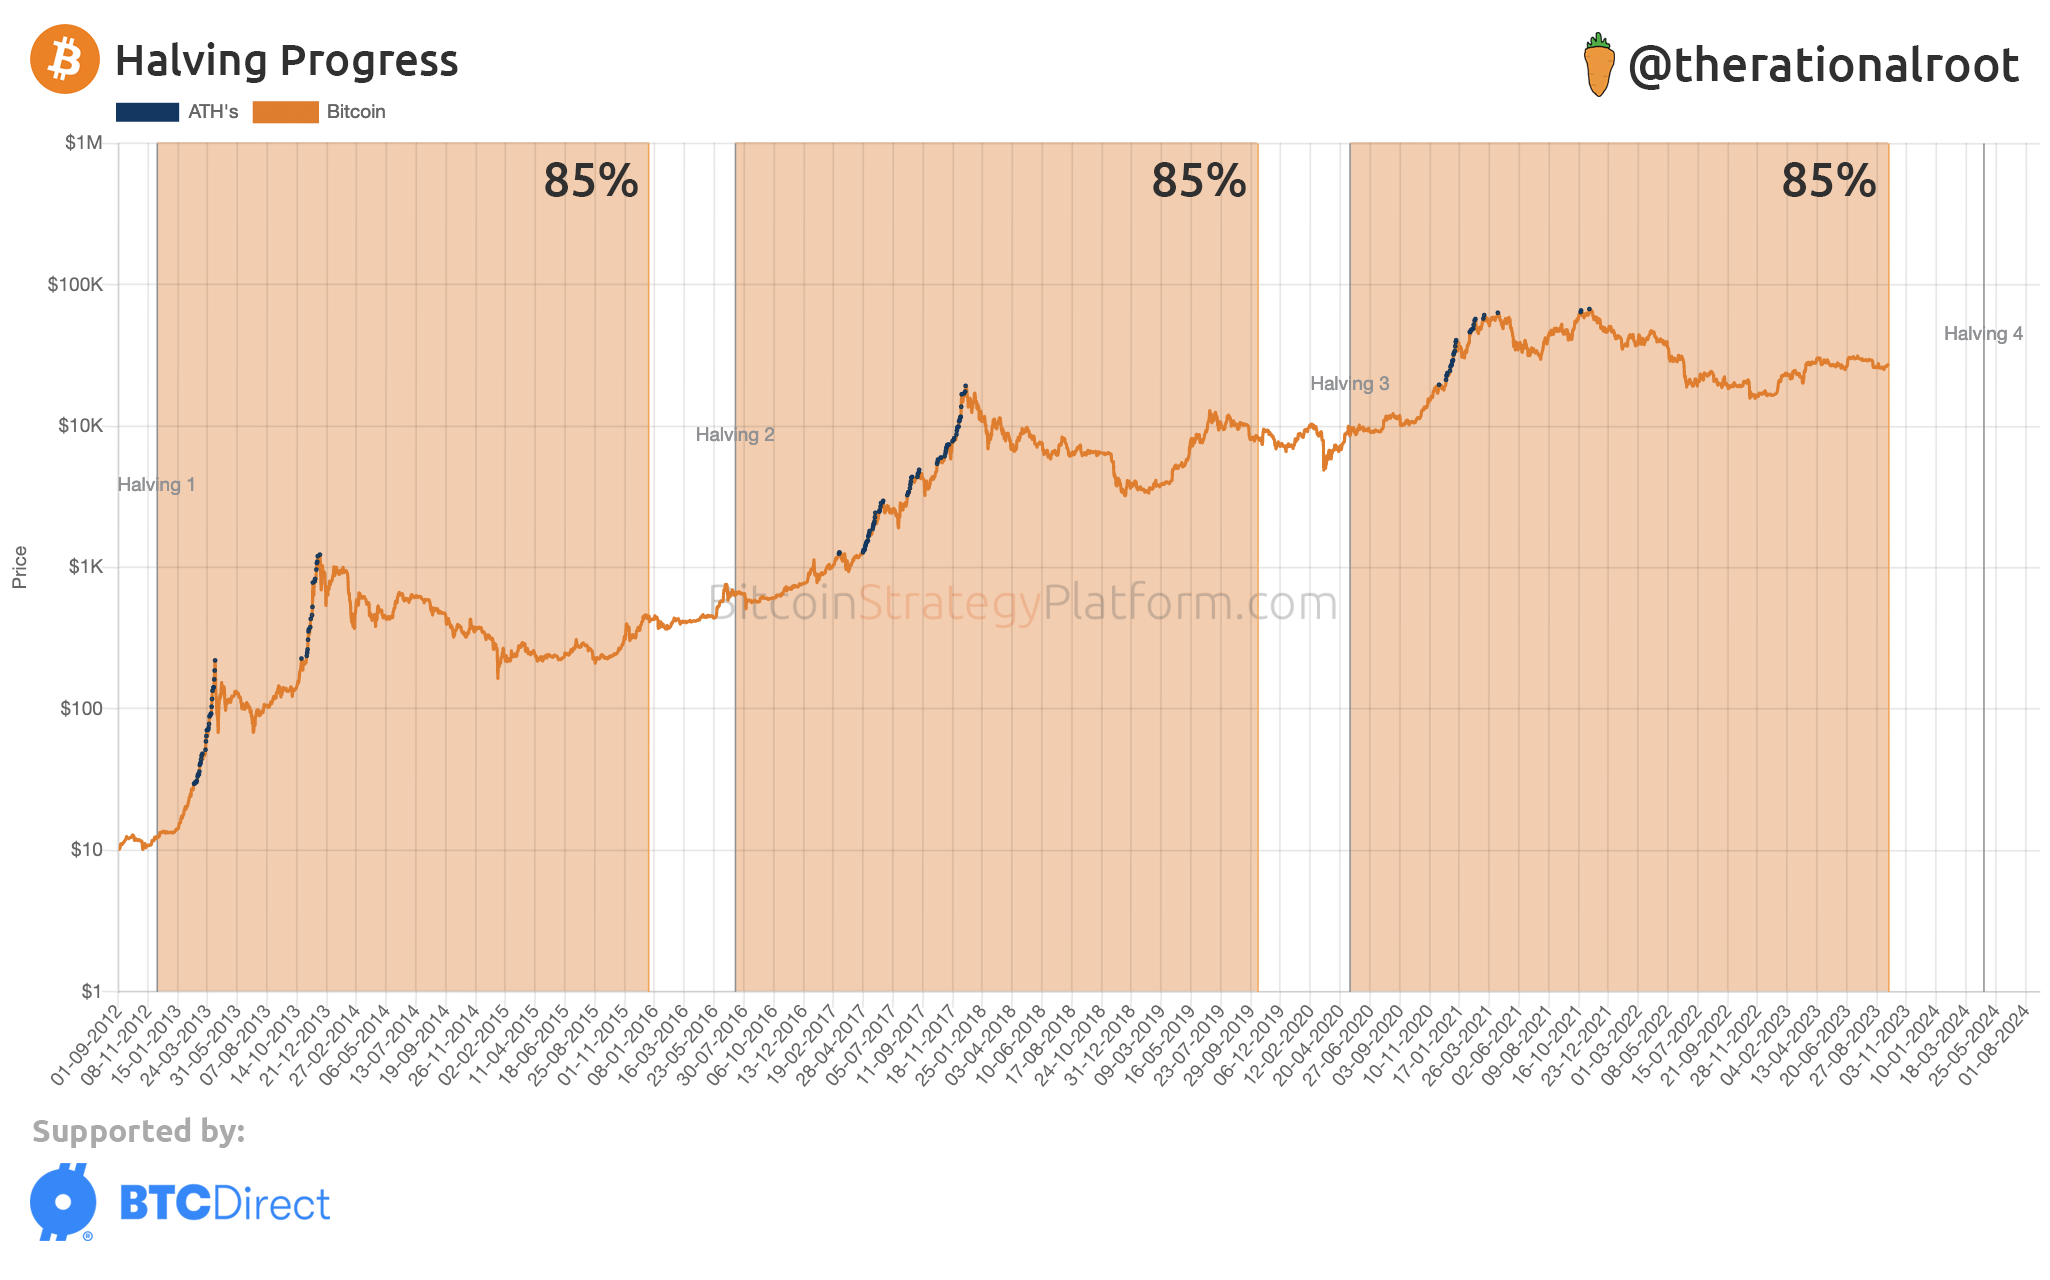
The analyst above also published another chart showing Bitcoin’s halving percentage progress. It compares the time periods between the historical halving of the previous 3 cycles.
According to @therationalroot, the current Bitcoin halving is already 85% complete. Moreover, the relatively small 15% cycle-end periods were characterized by similar BTC price action sideways. On both occasions – in 2016 and 2020 – the price of the largest cryptocurrency remained similar.
The difference is that 2 cycles ago, Bitcoin experienced a sideways trend with an upward bias. In the previous cycle, on the other hand, the black swan caused by the COVID-19 crash gave investors an additional opportunity. They could take an attractive position right before the planned halving.

If history were to repeat itself, then – in the grand scheme of things – the cryptocurrency market could face a roughly one-year sideways trend. Bitcoin halving, scheduled for mid-April 2024, may not immediately impact the price of BTC. Its effects may become apparent only in the last quarter of 2024 and throughout 2025.
This prediction is in line with the trends seen on the chart of supply held by long-term holders. The indicator is currently approaching the ATH. It will also need about 12 months to reverse its trend and move into a distribution phase. When LTHs start selling after Bitcoin halves, it will be one of the first signals of the beginning of a cryptocurrency bull run.


